Interactive Data Visualisation in Schnek
Posted 18th April 2018 by Holger Schmitz
Back in the old days computer were simple devices. When I got my first computer it was a Commodore 64. There were some games you could play but most of the fun to be had was in programming the device. With the Basic language you could directly access any place in the memory and manipulate its contents. In fact, this was the way to use most of the features of the C64. Special addresses in the memory would control the sound or the graphics. By simply changing the value you could start the sound generator or switch between the different screen modes. If you wanted to create graphics you would simply write the correct bits directly into the graphics memory and the pixels would instantly appear on the screen.
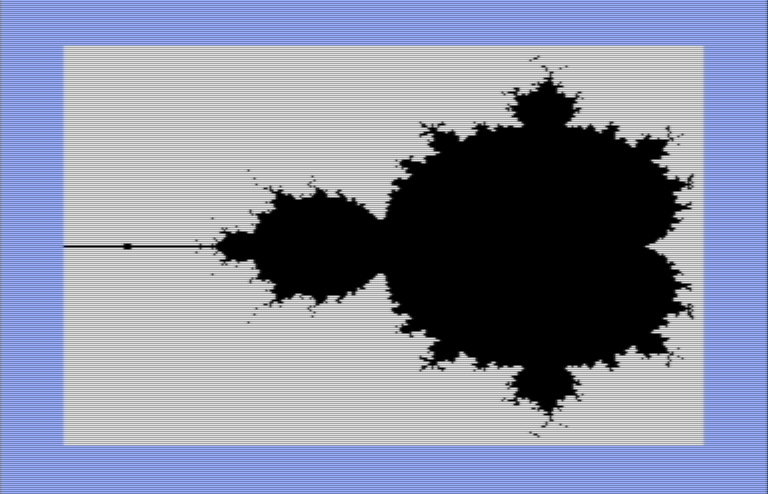
Mandelbrot Set on the C64
Of course, when I learnt about fractals and the Mandelbrot set I didn’t waste much time to try out creating these fascinating images on my home computer. On the right you can see what this might have looked like. The image was created using the Vice emulator for the Commodore 64. The Basic program is available on GitHub. It is not the original code that I used back in the past. I don’t have that any more. Instead it is a slightly modified version of the Mandelbrot code written by Joseph Dewey available from here. On the C64 it would have taken about 6 hours to produce the finished picture.
Ever since those days I was fascinated with using maths and physics to create computer images. This is what ultimately drove me into computational physics. Nowadays I run simulation codes on large computers. In almost all cases the software will not produce graphical output directly, but instead it will write lots of data to the hard drive. The data is turned into images during a second processing step. This is sensible because the codes will be run by a batch system on a computer cluster, and it will often run overnight. Creating nice graphics directly during run-time is not very useful in this situation.
On the other hand, I often think of the old times when I could play around with parameters and immediately see what is happening. Even nowadays this feature could still be useful when performing small test runs of the full scale simulations. Test runs are frequently needed to make sure that the parameters of a simulation are correct before starting an expensive run using hundreds or even thousands of cores. For this reason, I have written a small extension to the Schnek simulation library that will create a window and plot a colour plot of any two-dimensional data field.
The extension uses GTK to create a window inside a Schnek Block. This means that you can control the appearance of windows through the setup file of the simulation you are running. You should be able to open multiple windows and display different data in each window. The current implementation is relatively simple and will only work when running a simulation on a single processor. The code can be found on my GitHub repository.

GTK window in Schnek
Here are some implementation details. Just like any other UI toolkit, GTK likes to take control. This means that at some point you are supposed to call a function that will not return until the program is ended. Inside that function all the low level user interaction is taken care of. Your code then just sits and waits until the user has chosen to do something and GTK will call into your code. Naturally, this is not ideal for a simulation code. For this reason, I implemented a class that creates a new thread and runs GTK within this thread. At regular intervals the GTK thread checks if the ColorPlot component has updated its data and then proceeds to refresh the window that shows the data. I have manually implemented double buffering to avoid a flashing screen effect. Right now, there is only one single, very ugly, colour map to display the data. An example of a simulation output can be seen in the image on the left.