String Art and Heart Curves
Posted 12th March 2020 by Holger
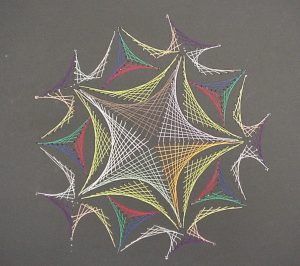
In my childhood, my parents would take us to the seaside for the summer holidays. One thing, other than the sun and the beach, that I distinctly remember were the nautic decorations in the cafes. One particular image was an abstract picture of a sailboat made from some nails hammered into a wooden board and pieces of string that were tied around those nails. It always fascinated me, how this simple arrangement of straight lines could create such a beautiful and dynamic image. Around the same time, in primary school, we used a similar technique in art class, with needle and thread and a piece of cardboard, to create an image of a snowflake.
It wasn’t until much later that I understood that the curves created by the thread could be described using mathematics. But while I knew that this had to do with maths somehow, during my school years I always thought that the maths was much too complicated for me to understand. Now, I have children and they have been doing similar art projects. From a teaching perspective, I am aware that these projects are intended to create an interest in maths. I think there is a missed opportunity when these line patterns are only used in primary school art lessons. The mathematics of the curves created by these lines can be accessible to secondary school students.
As an example, I want to present here the curve created by drawing straight lines in a circle. Here is the recipe:
- Draw a large circle on a piece of paper
- Draw a reasonably large number of equally spaced points around the circumference, about 20 to 30 should be OK
- Choose a point as point 0 and number the points around the circle, clockwise or anticlockwise
- Now draw a line
- from point 1 to point 2
- from point 2 to point 4
- from point 3 to point 6
- and so on, always connecting point $n$ with point $2n$.
Once the starting point has reached the opposite side, the endpoint will have reached point 0. Keep going by always incrementing the endpoint by two while moving the starting point by one.
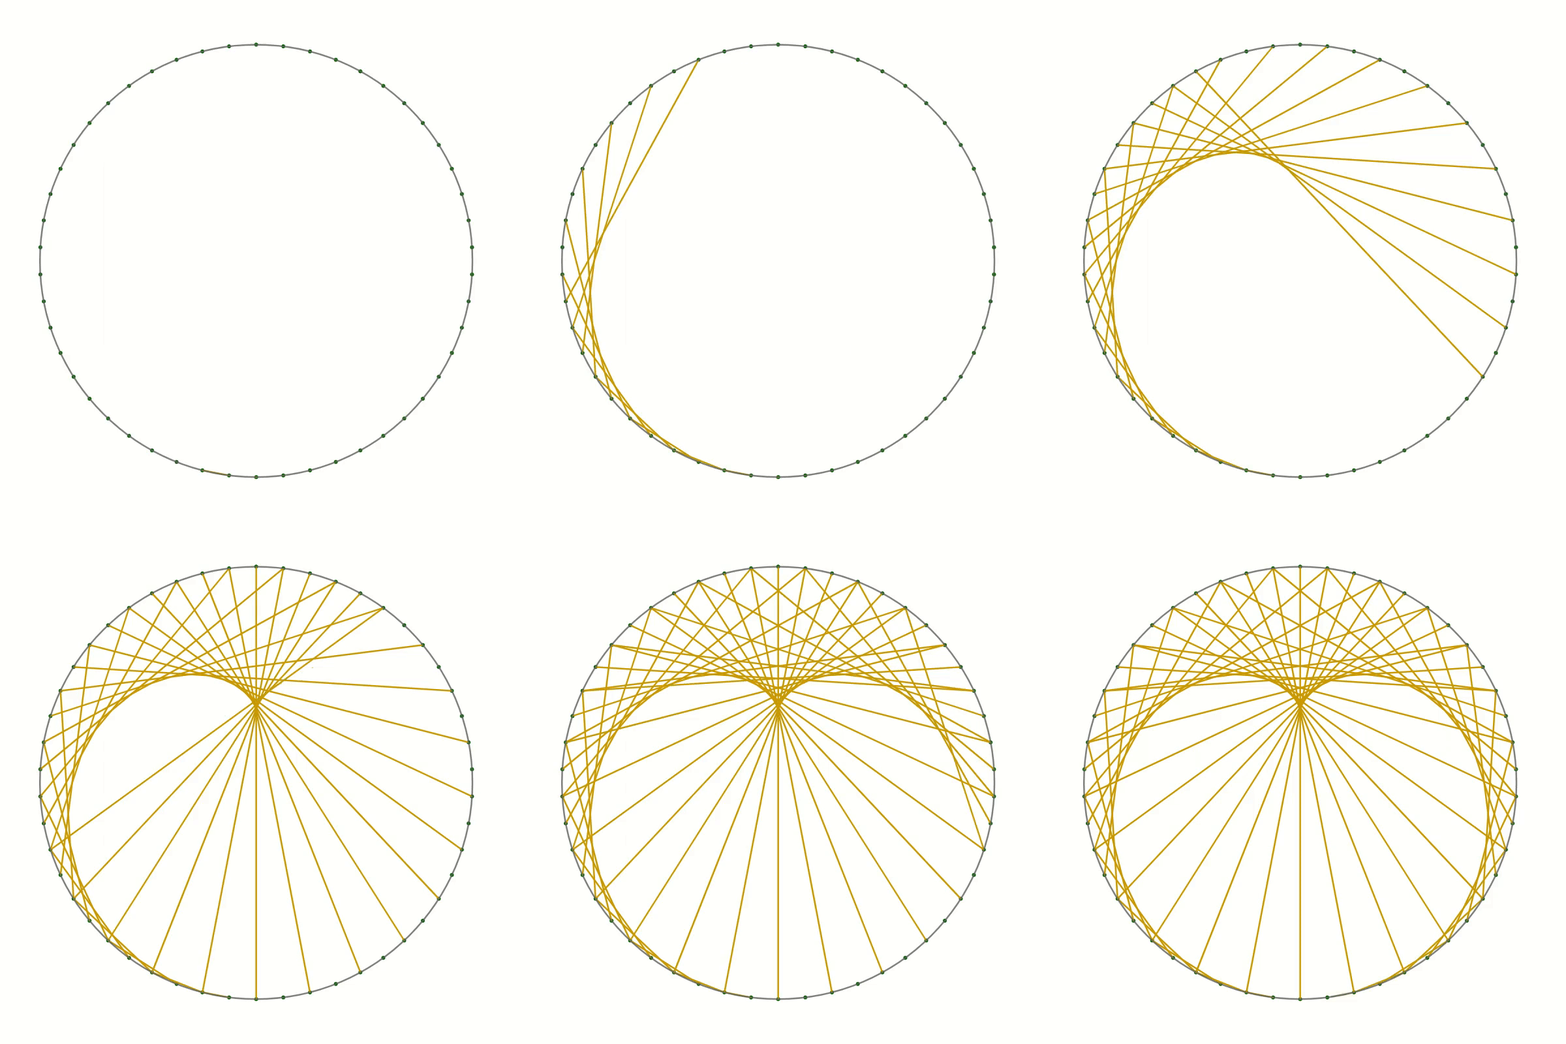
You should end up with something like this.
As you can see the lines you have drawn create an interesting pattern. In fact, the lines trace out a curve called the cardioid or heart curve. Each line you have drawn is a tangent to the cardioid. This means that each of the lines touches the cardioid in a single point.
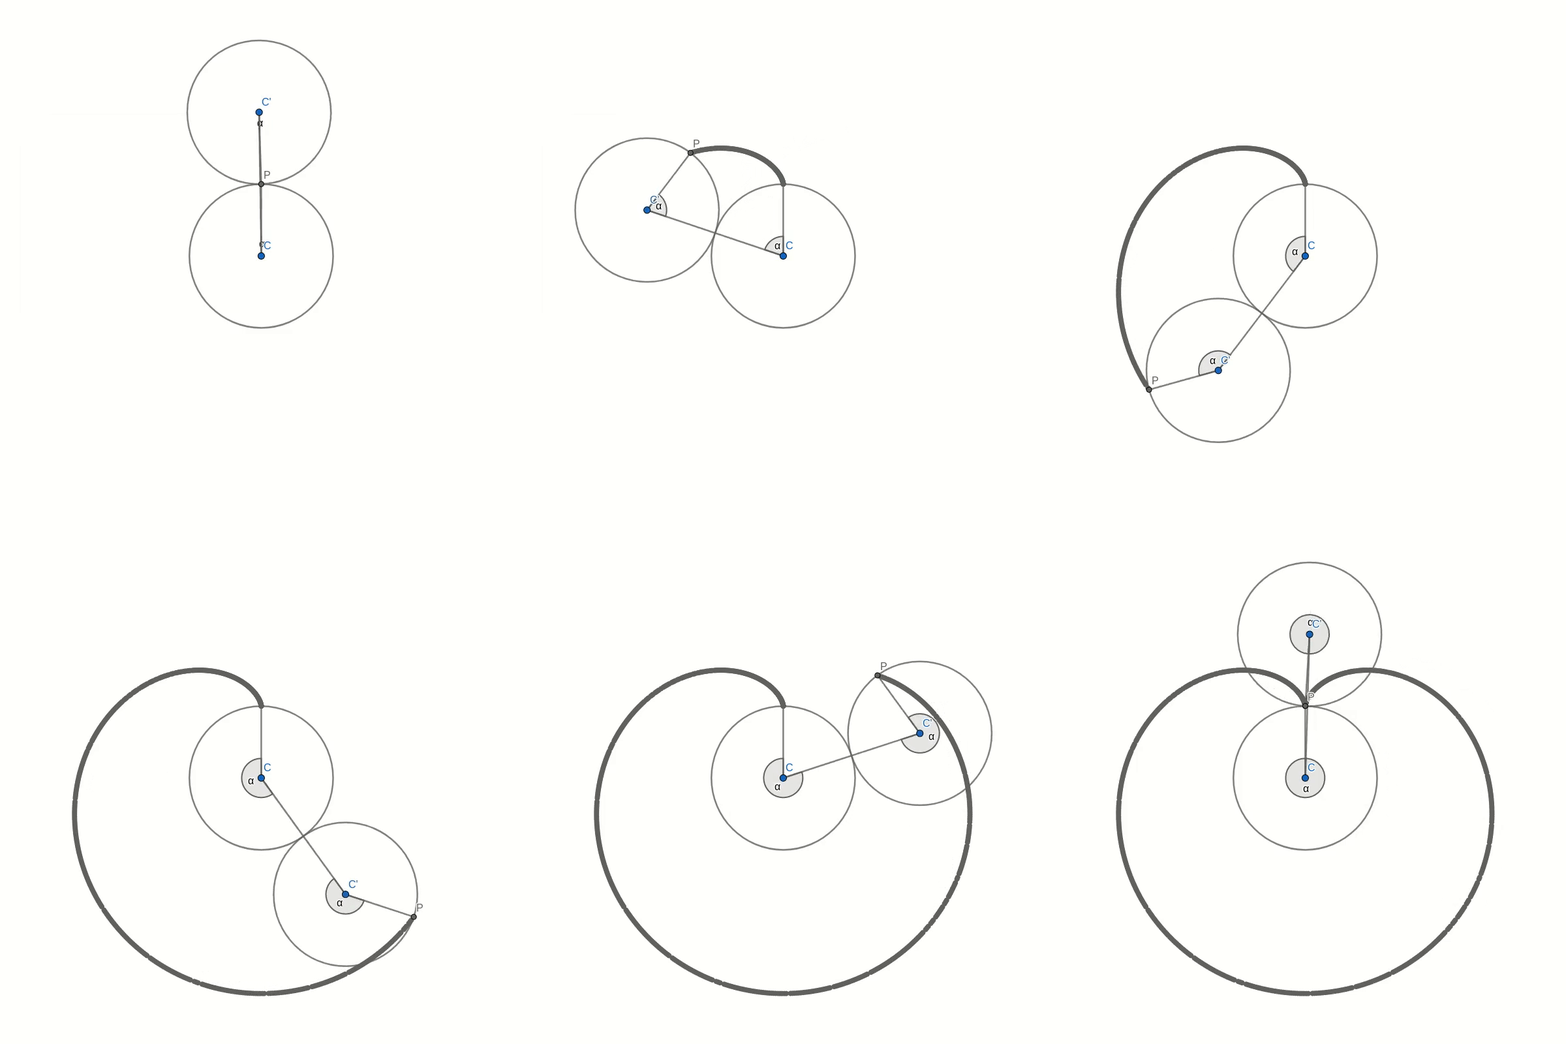
Let’s take a look at this cardioid curve. It is a special case of an epicycloid. This family of curves is generated by tracing a point on the circumference of one circle as it rolls around another circle. In the case of the cardioid, both circles have the same radius. The point that traces the curve is chosen to lie on the circumference of the outer circle. In the picture below you can see how the cardioid is created.
The curves in the two pictures look similar and if you were to place one image on top of the other, you would not see any difference in the curves. That seems to suggest that the two are in fact identical. But comparing images is not a mathematical proof. And surely you don’t believe this statement just because everybody on the internet claims it to be true.
If you look around, you can find several proofs that show you that the curve created by our string art is indeed the cardioid. But most of these proofs make use of trigonometry. This makes them inaccessible to anybody who is not yet comfortable with trigonometric identities. I believe that a purely geometric proof is easier to understand and also more beautiful than resorting to sine and cosine functions.
The proof
I order to prove the identity of the two curves we need to show two things. First, we need to show that our line construction intersects the cardioid in at least one point and we need to find that point. Then we need to show that the point that traces the cardioid moves in the direction of the line segment. This second part of the proof shows that the line segments are tangential to the cardioid.
Part 1: Constructing a point on the cardioid
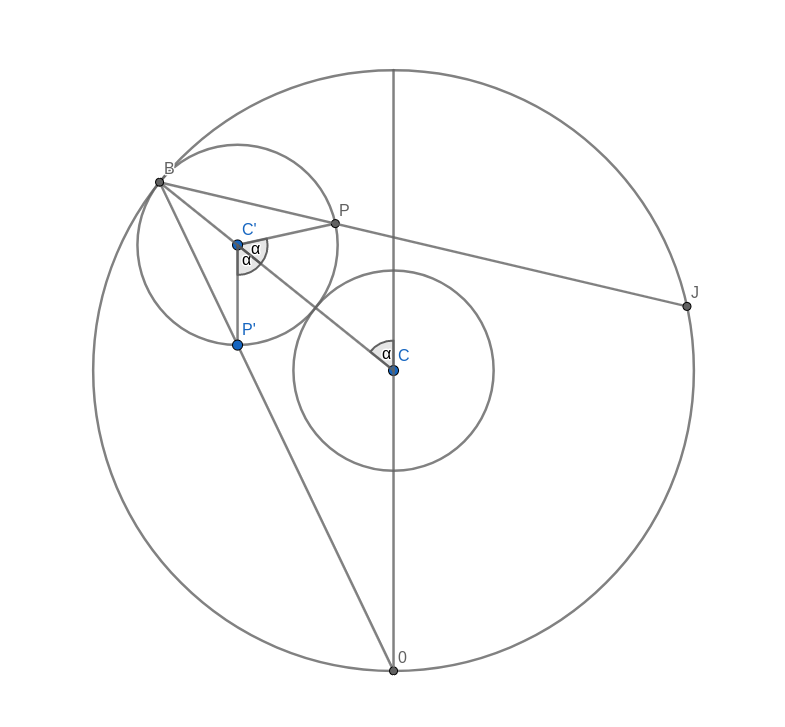
Look at the figure below. Don’t get too confused with all the lines and angles in the picture. I will explain everything bit by bit. Remember when you were drawing the string art picture. You were drawing a line from some start point to some endpoint. In the diagram below, I have taken one of those lines and named the start point B and the endpoint B’. I have also connected the origin point 0 to the start point B. Now, B’ moves around the circle twice as fast as point B. This means that the distance from B to B’ is the same as the distance from 0 to B. In other words, if you draw a line from the centre C of the big circle to B, the figure is symmetric with respect to that line.
Now, look at the two small circles. The circle at the centre C of the large circle stays fixed. The small circle centred at C’ on the connection between C and B is the circle that rolls along the circumference and creates the cardioid. The line B-B’ intersects this outer circle at a point P. We need to show that this intersection point P is the same as the point that stays fixed on the outer circle as it rolls along. We can prove this by showing that the angle C-C’-P is the same as the angle that C-C’ makes with the vertical through the central point C.
Take the intersection between the line A-B and the rolling circle and call it P’. You can immediately see that the triangles A-B-C and P’-B-C’ are similar. This means that the line P’-C’ is vertical, just like the line A-C. It follows that the angle C-C’-P’ is the same as the angle that C-C’ makes with the vertical because they are opposite angles. But because of the symmetry of the construction, this angle is also the same as C-C’-P.
With this, we have shown that the intersection point P is, in fact, a point on the cardioid curve.
Part 2: Direction of motion of P
The motion of the point P, as the outer small circle rolls around the inner circle, is made up of two contributions. The first is the motion of the centre C’ orbiting around the inner circle. The second is the motion due to the rolling circle spinning around its own centre. We need to look at the direction and magnitude of each of these velocities.
Let’s say that the radius of the small circles is 1 and the angular velocity of the rotation of the outer circle around the inner is also 1. The exact values are not important because we only need to compare the two contributions of the velocity of point P. We don’t need to find its absolute value.
Orbital Velocity
The orbital velocity is oriented perpendicular to the connection C-B which also is parallel to the tangent to the circle through B. This means that naturally, the angle between this velocity and the line B-P is the same as the angle between the tangent and B-P. To compare the magnitudes we have to remember some equation from physics. The speed of a point rotating around a centre is the product of the distance to the centre and the angular velocity. Let’s call the radius of the small circle $R$ and the angular velocity of the rotation of the outer circle around the inner circle $\omega$ (that’s the lowercase Greek letter omega). The distance of the outer centre to the centre of rotation is $2R$ and this makes the speed of the orbital rotation equal to
$$v_{\text{orbit}} = 2R\omega.$$
Now let’s look at the velocity of the spin rotation. The point P rotates around the centre of rotation C’. The radius is $R$ but the angular velocity is $2\omega$. To see this, look at the vertical line C’-P’. This line stays vertical at all times. In part 1 of the proof we already saw that that the angle C-C’-P’ is the same as the angle that C-C’ makes with the vertical, so as C’ moves around C by some angle, C-C’-P’ will increase by the same amount. But so will C-C’-P. This means that the angle P’-C-P increases twice as fast as the orbital angle. The resulting speed of the spin motion is
$$v_{\text{spin}} = R\times 2\omega.$$
We can see that the magnitude of the velocity of the spin motion is equal to that of the orbital motion. We also saw that the line B-P halves the angle between those two velocities. This means that the sum of these two velocities must lie in the direction of B-P. In other words, B-P is a tangent to the motion of the point P which is what we needed to prove.
Summary
I admit that this proof is somewhat lengthy but I do think that it gives some interesting insight into why the pattern of lines created by our initial construction generates the cardioid curve. All the figures for this post were created with Geogebra and are available online.
Leave a Reply
