Computational Physics Basics: Accuracy and Precision

Posted 24th August 2021 by Holger
Problems in physics almost always require us to solve mathematical equations with real-valued solutions, and more often than not we want to find functional dependencies of some quantity of a real-valued domain. Numerical solutions to these problems will only ever be approximations to the exact solutions. When a numerical outcome of the calculation is obtained it is important to be able to quantify to what extent it represents the answer that was sought. Two measures of quality are often used to describe numerical solutions: accuracy and precision. Accuracy tells us how will a result agrees with the true value and precision tells us how reproducible the result is. In the standard use of these terms, accuracy and precision are independent of each other.
Accuracy
Accuracy refers to the degree to which the outcome of a calculation or measurement agrees with the true value. The technical definition of accuracy can be a little confusing because it is somewhat different from the everyday use of the word. Consider a measurement that can be carried out many times. A high accuracy implies that, on average, the measured value will be close to the true value. It does not mean that each individual measurement is near the true value. There can be a lot of spread in the measurements. But if we only perform the measurement often enough, we can obtain a reliable outcome.
Precision
Precision refers to the degree to which multiple measurements agree with each other. The term precision in this sense is orthogonal to the notion of accuracy. When carrying out a measurement many times high precision implies that the outcomes will have a small spread. The measurements will be reliable in the sense that they are similar. But they don’t necessarily have to reflect the true value of whatever is being measured.
Accuracy vs Precision
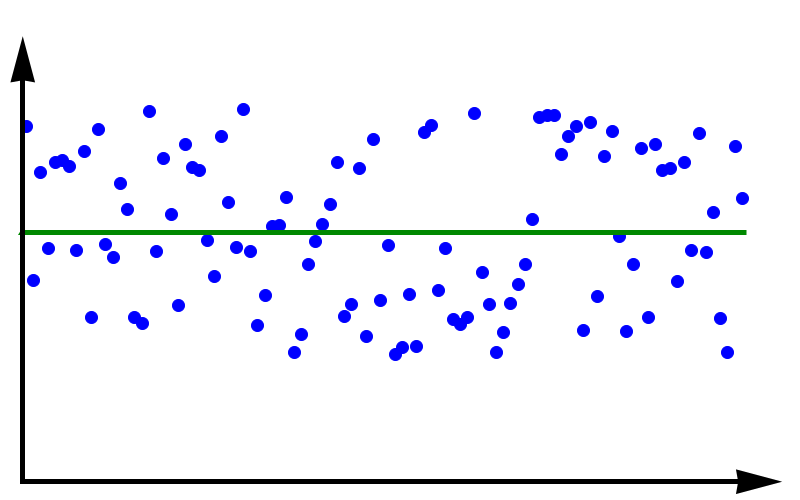
Data with high accuracy but low precision. The green line represents the true value.
To fully grasp the concept of accuracy vs precision it is helpful to look at these two plots. The crosses represent measurements whereas the line represents the true value. In the plot above, the measurements are spread out but they all lie around the true value. These measurements can be said to have low precision but high accuracy. In the plot below, all measurements agree with each other, but they do not represent the true value. In this case, we have high precision but low accuracy.
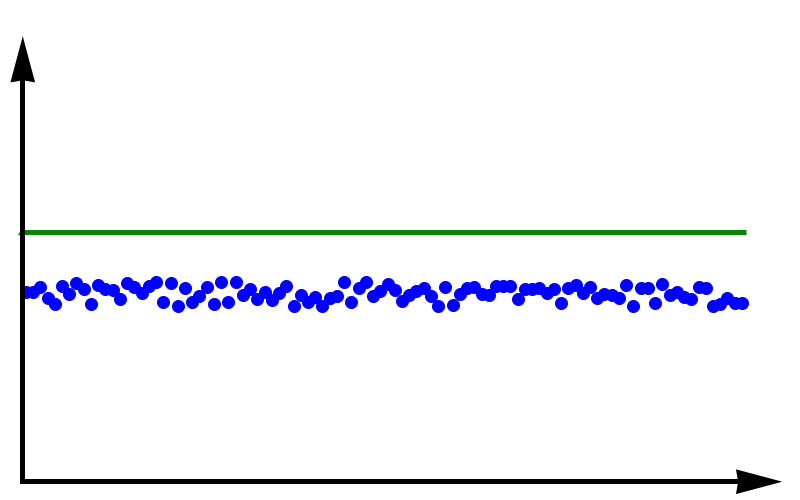
Data with high precision but low accuracy. The green line represents the true value.
A moral can be gained from this: just because you always get the same answer doesn’t mean the answer is correct.
When thinking about numerical methods you might object that calculations are deterministic. Therefore the outcome of repeating a calculation will always be the same. But there is a large class of algorithms that are not quite so deterministic. They might depend on an initial guess or even explicitly on some sequence of pseudo-random numbers. In these cases, repeating the calculation with a different guess or random sequence will lead to a different result.
Leave a Reply